Held and loaded, side by side
Try checking a loading skeleton by reloading a page. On a fast connection, it’s on screen for a fraction of a second. You see a gray flicker, then content, and you can’t tell whether a bar was 2 px short or the heading moved. Multiply that by every section of every page, at two screen sizes, and checking by eye stops being a plan.
So GameKal’s desktop site has two developer tools for it. Add ?skeleton=hold to any page and it freezes in its loading state for as long as you like. Add ?skeleton and you get a comparison view: the frozen loading page and the loaded page, one over the other, with a divider you can drag, a Difference mode, and live readouts of height and layout shift. Every desktop skeleton in GameKal’s move away from a loading screen was checked with it.
This post covers what the tools show, how they’re built, and three problems they caught that I wouldn’t have seen otherwise. It also covers where I want to take them next: comparing a local build with production.
Freezing the loading state
One flag holds the whole app in its loading state. Every component that has a skeleton reads the same signal to decide whether it’s ready. ?skeleton=hold forces that signal to “not ready” and leaves it there, so the page stays exactly as a visitor sees it in the moment before data arrives.
Held means held. In that state nothing animates except the skeleton blocks’ gentle pulse. That was a rule for the product anyway, and it makes the tool useful: a frozen frame is the same frame every time you look.
The comparison view
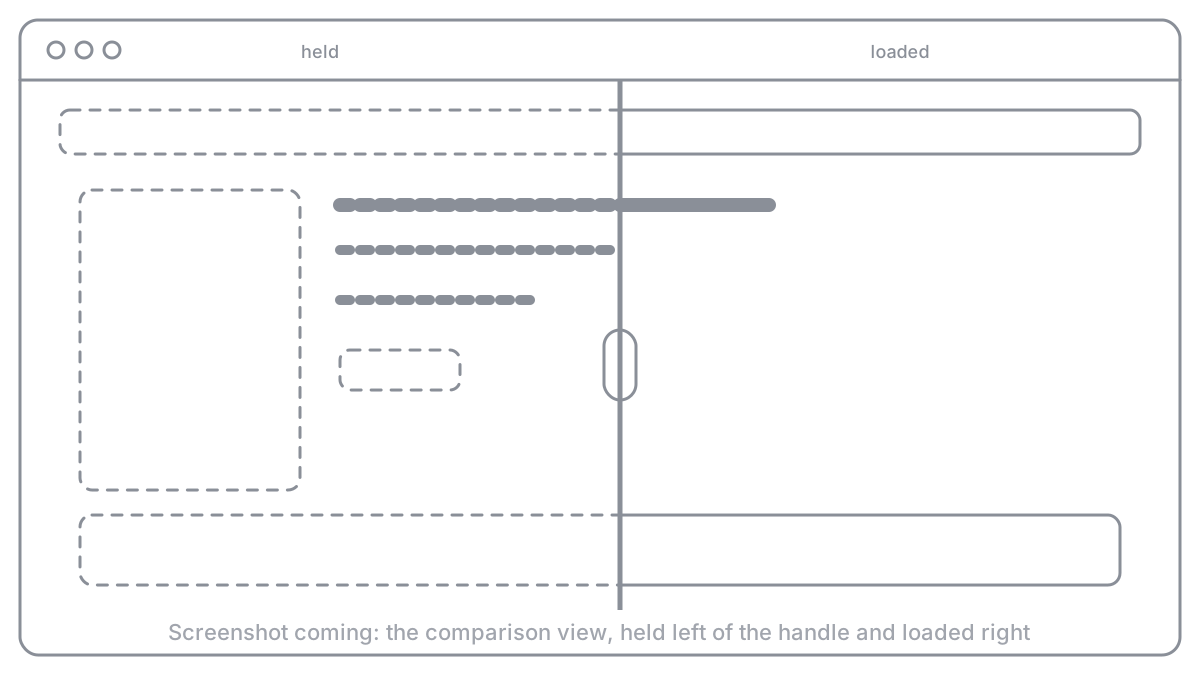
?skeleton loads the same page twice, in two frames stacked on top of each other: one held, one loaded normally. A full-height handle splits them, and dragging it, or pressing the arrow keys, slides the boundary across the page. Held is on the left of the line, loaded on the right. Both frames scroll together and follow each other’s tab changes. If a skeleton is right, the line crosses the page without anything jumping at it.
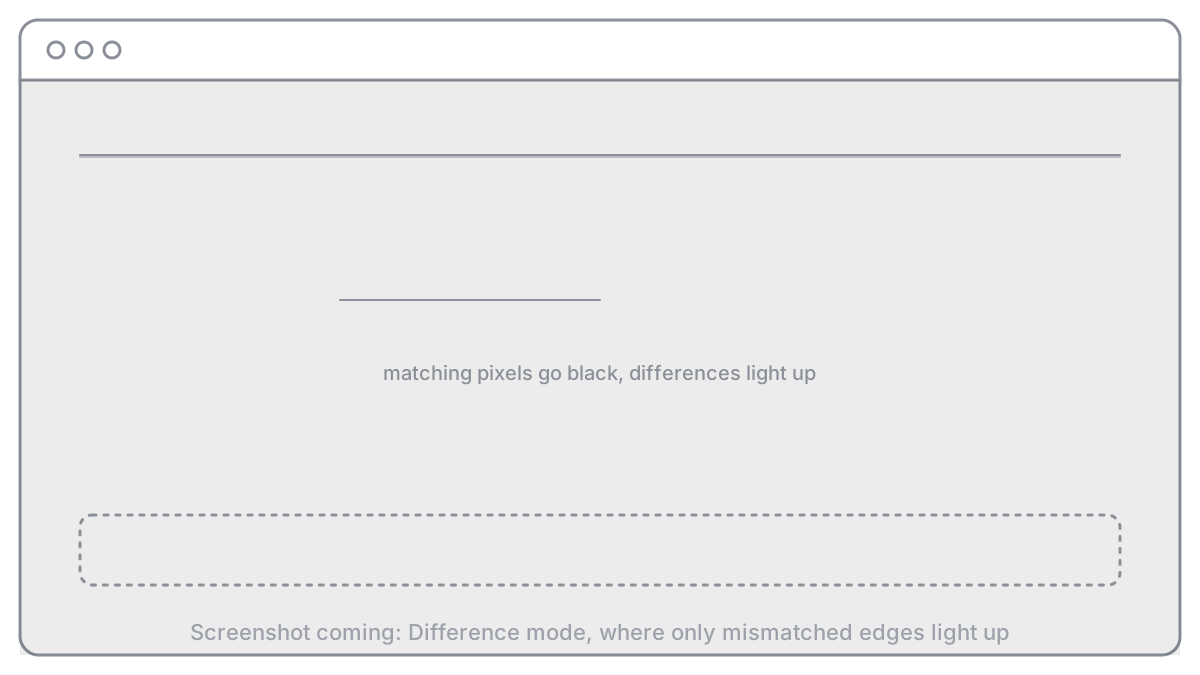
Difference mode blends the two frames so identical pixels cancel to black and anything that differs lights up. A skeleton bar that’s 1 px off becomes a bright 1 px line.
The top bar reads out what changed. Frame height for held and loaded, with the difference in px. Where the footer starts in each. And a layout shift score for each frame, measured in the page with the browser’s own layout-shift entries. A Shifts panel lists what moved: each element, how often, its largest move, and its share of the score. Reload both reloads the pair, and Exit goes back to the normal page.
How a check runs
One page, one screen size. Not to scale.
in two frames
then Difference
CLS, Shifts
loaded match
Three things it caught
A 1 px hairline, and the wrong fix for it. Difference mode showed a 1 px line under the “All games” bar on Home. Trimming that bar by 1 px made the line go away, and it was the wrong fix. Sliding the divider slowly showed the hero section above it sat 1 px lower when loaded. The bar was fine. The hero was off, and trimming the bar would have hidden that.
A header 2 to 3 px short. The “This week” header bar’s skeleton was slightly shorter than the real one. On a normal reload, that’s a tiny jump you’d never point to. In the comparison view, the rows under it visibly stepped down when the divider crossed them.
A whole gallery missing. On a desktop game page, the readout said the loaded frame was 593 px shorter than the held one: 1,612 px against 1,019 px, with the footer moving by the same amount. The gallery’s skeleton was there and the gallery wasn’t. That turned out to be a real bug in how game records load, which has its own story in The setting only production had. Worth saying plainly: the tool showed me the bug before I understood it, and I explained it away the first time.
The game page that came up short
Page frame height in the comparison view, desktop.
Measuring outside the tool
The comparison view is a desktop page. At phone sizes, and on the live site, I measured layout shift with a few lines pasted into the console instead. They collect the browser’s layout-shift entries since the page loaded, skip any caused by input, and add them up:
(async () => {
  const shifts = [];
  await new Promise((done) => {
    new PerformanceObserver((list) => {
      for (const entry of list.getEntries()) if (!entry.hadRecentInput) shifts.push(entry);
    }).observe({ type: 'layout-shift', buffered: true });
    setTimeout(done, 300);
  });
  console.log('CLS', shifts.reduce((sum, e) => sum + e.value, 0).toFixed(3), shifts);
})();
Each entry also lists its sources, the elements that moved and their boxes before and after, which is how the 0.46 on a phone game page turned into “the sheet opens empty, then grows”.
How it’s built
It’s deliberately small. The held state is the same signal the product uses, forced on by a URL parameter that’s read once when the page loads, so the tool can’t drift from what visitors see. The comparison view loads the current path in two iframes, one with ?skeleton=hold and one with ?skeleton=off. The held frame sits on top, clipped to the left of the handle. Difference mode drops the clip and sets mix-blend-mode: difference on it, so the browser does the pixel comparison while compositing. The readouts come from inside each frame: the page height, the top of the footer, and a layout-shift observer per document. Nothing links to it. It exists only when the query asks for it.
Next: local against production
The same view can answer a different question: does my local build look exactly like what’s live? Put the local page in one frame and production in the other, at the same path and size, and the divider and Difference mode work as they do now. Anything that lights up is a change I haven’t shipped, or one I didn’t mean to make.
It’s not built yet, and there are honest limits:
- Data has to match. Local and production must show the same games on the same day, or every cover lights up.
- Fonts and images must load the same way. A fallback font on one side is a difference on every line of text.
- Some readouts stop at the origin. Blending two frames works across sites, because the browser composites them. Reading layout shifts or heights from inside a frame on another site doesn’t, so production’s numbers would come from production’s own console or a script.
What I learned
Looking back, three lessons stand out.
If you can’t see it, freeze it. A state that lasts 100 ms can’t be reviewed. One URL parameter that holds it turned skeleton work from guessing into looking.
Put the two states on the same pixels. Side by side, a 2 px difference is invisible. Overlaid with a divider, it’s obvious.
A tool is only as good as your willingness to believe it. The 593 px gap was real the first time it showed up. I’d have saved an hour by trusting the measurement over a plausible story.
What’s next?
The local-against-production mode, and phone sizes inside the comparison view itself, so I don’t need the console snippet.
A loading state used to be the part of the page nobody could see clearly. Now it’s the part I can look at longest.